Narrative
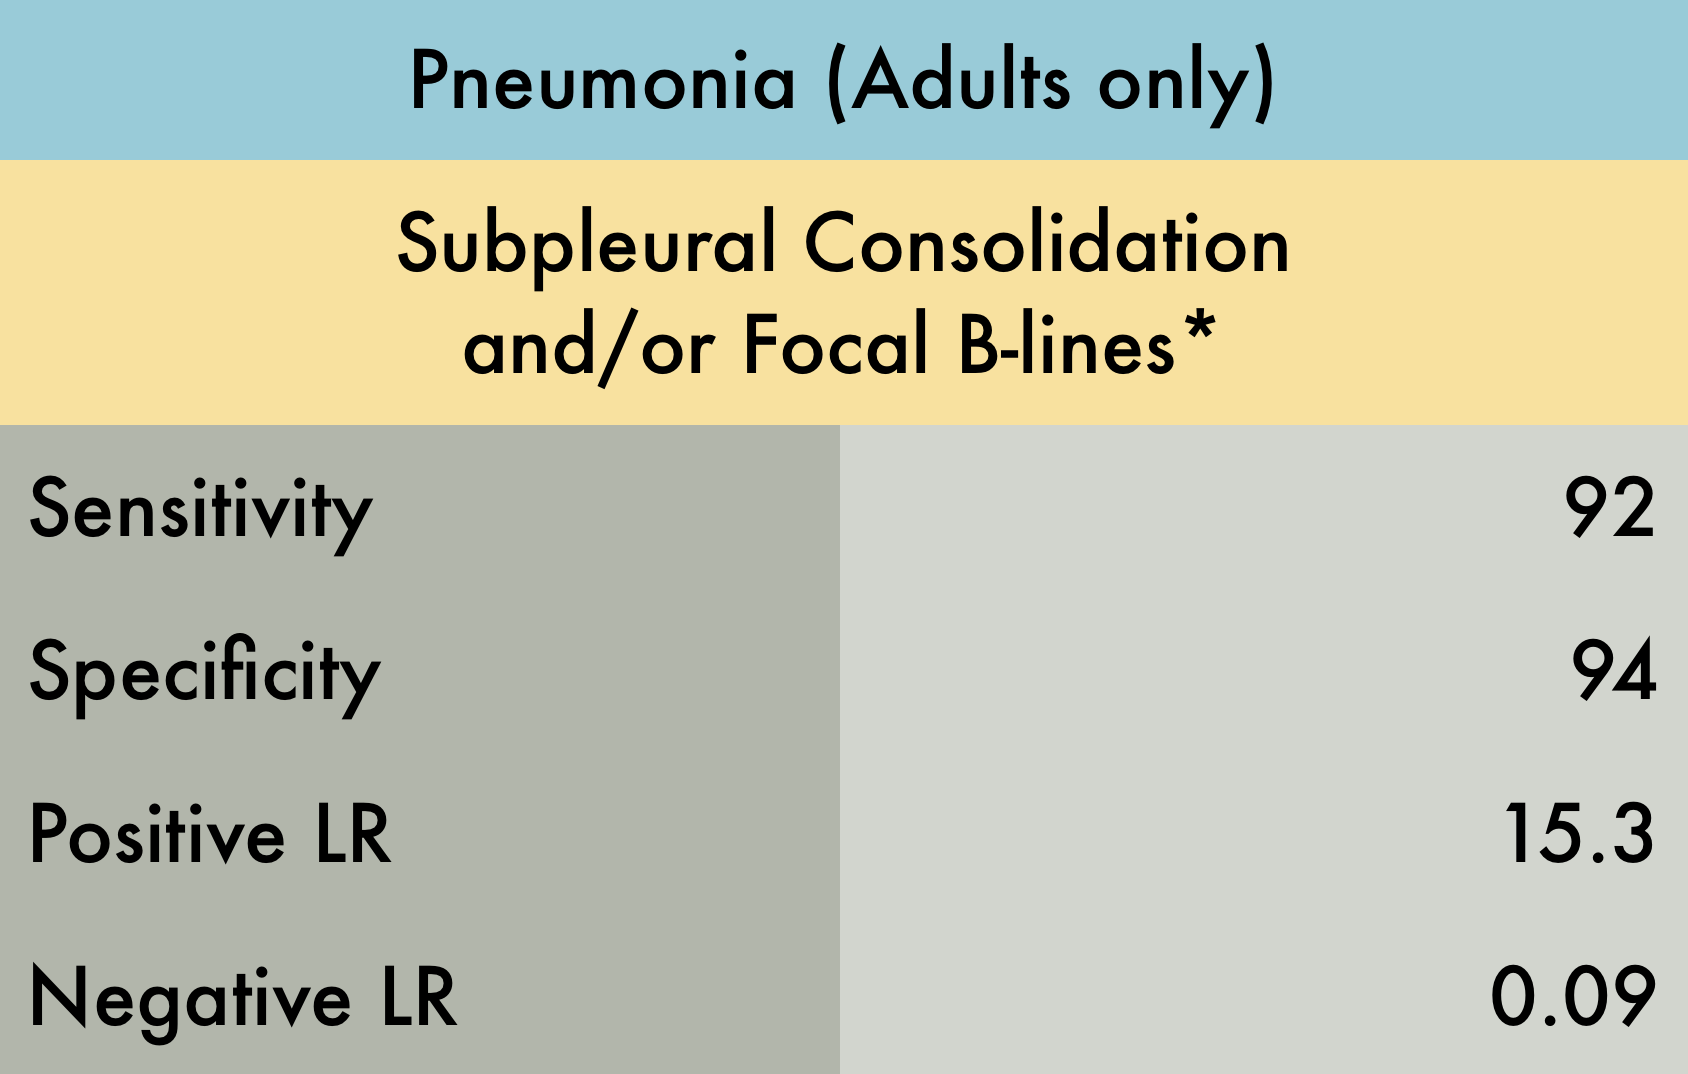
This was a systematic review including 17 prospective studies (n=5108) evaluating the operating characteristics of lung ultrasound for pneumonia in adult patients seen in the emergency department with a clinical suspicion for this diagnosis. Reference standard was either chest radiograph, chest CT, or final clinical diagnosis. Included studies varied with regards to which and how many lung fields were evaluated. The operators performing ultrasound examinations were exclusively emergency physicians or radiologists.*Subpleural consolidation and/or focal B-lines were the diagnostic criteria in the majority of manuscripts included, however in 4 studies, no clear positive findings were specified.
Caveats
Note: accuracy of ultrasound is operator-dependent. Reported LRs may not be reproducible by an inexperienced sonographer.
Published in collaboration with The POCUS AtlasAuthor
Kyle Kelson, MD
Published/Updated
September 13, 2018
What are Likelihood Ratios?
LR, pretest probability and posttest (or posterior) probability are daunting terms that describe simple concepts that we all intuitively understand.
Let's start with pretest probability: that's just a fancy term for my initial impression, before we perform whatever test it is that we're going to use.
For example, a patient with prior stents comes in sweating and clutching his chest in agony, I have a pretty high suspicion that he's having an MI – let's say, 60%. That is my pretest probability.
He immediately gets an ECG (known here as the "test") showing an obvious STEMI.
Now, I know there are some STEMI mimics, so I'm not quite 100%, but based on my experience I'm 99.5% sure that he's having an MI right now. This is my posttest probability - the new impression I have that the patient has the disease after we did our test.
And likelihood ration? That's just the name for the statistical tool that converted the pretest probability to the posttest probability - it's just a mathematical description of the strength of that test.
Using an online calculator, that means the LR+ that got me from 60% to 99.5% is 145, which is about as high an LR you can get (and the actual LR for an emergency physician who thinks an ECG shows an obvious STEMI).
(Thank you to Seth Trueger, MD for this explanation!)