Narrative
Hemodynamically unstable patients are often given intravenous (IV) crystalloids and colloids to increase cardiac output and improve tissue perfusion. If successful, this is called fluid responsiveness. However, IV fluid therapy may cause pulmonary or peripheral edema, abdominal compartment syndrome, or impair oxygen diffusion. The clinician must decide, based on static and dynamic tests, whether vasopressors or inotropes should be used instead.
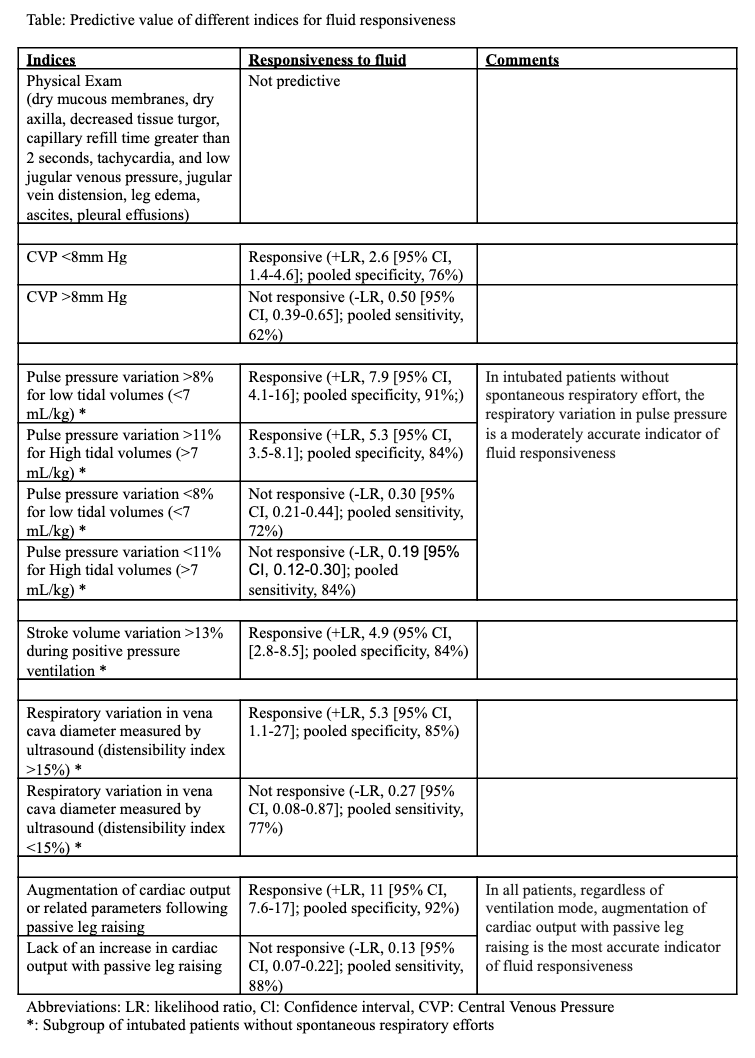
Static tests measure central venous pressure, often a good approximation of right atrial pressure, and pulmonary capillary wedge pressure. In contrast, dynamic measurements analyze changes in cardiac output or related parameters in response to bedside maneuvers that transiently change preload. The purpose of the systematic review summarized here is to provide summary estimates of the accuracy of the various symptoms, signs, and measurements used to predict fluid responsiveness in patients with refractory hypotension, signs of organ hypoperfusion, or both.
The systematic review discussed here, included 50 studies (n=2260) from intensive care unit settings, using a variety of invasive and noninvasive reference standards. Fluid responsiveness was defined as an increase in cardiac output of at least 15% in 39 of 50 trials and at least 10% in the other 11 trials. Mean prevalence of fluid responsiveness was 50% (95% CI, 42% - 56%). In all studies indices were measured before assessment of fluid responsiveness.
In pooled estimates, an increase in cardiac output with passive leg raising had the strongest likelihood ratios for an indicator of fluid responsiveness, as did the presence of respiratory variation in vena cava diameter measured with ultrasound and pulse pressure variation in the subset of mechanically ventilated patients. Lack of change in cardiac output with passive leg raise was the strongest indicator of the absence of fluid responsiveness.
Adverse Effects
No direct adverse effects were reported for the tests summarized here.
Caveats
This meta-analysis has several limitations, mainly that generalizability is uncertain. Individuals with arrhythmias, cardiogenic pulmonary edema, oxygen deficits, valvular disease, and ventricular failure were excluded. Some were also excluded if it was deemed dangerous or unethical to withhold fluids, and in some cases patients had already been extensively fluid resuscitated and on vasopressors prior to enrollment. Cardiac output measurements via TTE in these studies were performed by individuals with specific echocardiography training, hence applicability to physicians without equivalent skill is low.
Definitions of fluid responsiveness varied (from 10 to 15%) and most studies did not use thermodilution via pulmonary artery catheter, the reference standard for cardiac output.
, Some trials also used poorly validated methods to determine fluid responsiveness, and virtually all studies enrolled a small convenience sample. The review authors deemed the overall quality of evidence to be high. However, there is tremendous variation in reference standards, shifting definitions of fluid responsiveness, and small convenience samples of often dissimilar subjects. This brings us to question the generalizability of the studies and validity of pooling data.
A meta-analysis published in 2016 found similar numbers to this review for the passive leg raise test, noting that mode of ventilation, type of fluid, starting position for the test, and measurement technique did not affect diagnostic performance. Conversely, a more recent, more rigorous review of dynamic tests found fewer acceptable studies, and weaker estimates of accuracy, particularly for passive leg raise. The authors also found pooling of data to be inappropriate based on high heterogeneity, low study quality, and different reference standards. Finally, a recent review of respiratory variation in vena cava diameter also found this test’s utility to be limited, especially when used in spontaneously ventilated patients, and negative results could not be used to rule out fluid responsiveness.
Notably, no patient-centered outcomes were examined or reported in this systematic review. The tests assessed were designed to predict fluid responsiveness, a characteristic never rigorously evaluated as a guide for improving resuscitation, despite widespread use. Ultimately, therefore, the tests are physician-centered, and while we have reason to hope they are patient-centered as well, they may or may not lead to improved patient outcomes even if accurate.
In conclusion, we find serious flaws in the evidence base. It is promising that results across these studies—the best data presently available—were generally consistent, but more rigorous, larger investigations are badly needed, both to determine the accuracy of these tests and, of greater importance, to determine the utility of fluid responsiveness as a resuscitation guide. In terms of findings, change in cardiac output following passive leg raising was the most accurate predictor of fluid responsiveness in critically ill subjects who had already undergone initial resuscitation. The accuracy of change in IVC diameter with respiration to predict fluid responsiveness was modest in mechanically ventilated patients, and no test summarized here could rule out fluid responsiveness with certainty.
The original manuscript was published in
Journal of Evidence-Based Healthcare as part of the partnership between TheNNT.com and the journal.
Author
Jia Jian Li; James Hassel, MD: Joel Gernsheimer, MD
Supervising Editors: Kabir Yadav, MD; Allan Wolfson, MD; Shahriar Zehtabchi, MD
Published/Updated
November 1, 2019
What are Likelihood Ratios?
LR, pretest probability and posttest (or posterior) probability are daunting terms that describe simple concepts that we all intuitively understand.
Let's start with pretest probability: that's just a fancy term for my initial impression, before we perform whatever test it is that we're going to use.
For example, a patient with prior stents comes in sweating and clutching his chest in agony, I have a pretty high suspicion that he's having an MI – let's say, 60%. That is my pretest probability.
He immediately gets an ECG (known here as the "test") showing an obvious STEMI.
Now, I know there are some STEMI mimics, so I'm not quite 100%, but based on my experience I'm 99.5% sure that he's having an MI right now. This is my posttest probability - the new impression I have that the patient has the disease after we did our test.
And likelihood ration? That's just the name for the statistical tool that converted the pretest probability to the posttest probability - it's just a mathematical description of the strength of that test.
Using an online calculator, that means the LR+ that got me from 60% to 99.5% is 145, which is about as high an LR you can get (and the actual LR for an emergency physician who thinks an ECG shows an obvious STEMI).
(Thank you to Seth Trueger, MD for this explanation!)